In spring 2019, Prof. Nathan Ryan (Mathematics) debuted a new course, MATH219: Solving Industrial Problems. The course was developed out of a grant he received from PIC Math, a program funded by the Mathematical Association of America and the National Science Foundation with the goal of preparing students for careers by engaging them in research problems that come directly from industry.
The course divided students into project groups, each having a real-world client with a specific problem to be addressed. Janine Glathar, GIS Specialist for Digital Pedagogy & Scholarship, co-taught the course with Professor Ryan, working with 2 of the 3 project groups on using GIS tools and methodologies in developing solutions for their clients:
School Bus Group
- Client: Lewisburg Area School District
- Problem: Map current school bus routes and generate options for new, optimized routes.
The school bus routing problem (SBRP) is a challenging research problem that has been studied by researchers from various disciplines for almost 50 years. Public school districts across the country struggle to balance the logistical demands of providing safe, reliable, accessible transportation to their students with the costs incurred (driver salaries, fuel, maintenance, greenhouse gas emissions, etc.). The task for the three students assigned to this project (Ellie Siegfried ‘19, Tim Briggs ‘21, and Derrick Yao ‘22 – all Mathematics majors) was to analyze the efficiency of the bus stops and routes currently used by the Lewisburg Area School District (LASD) and develop their own optimized solutions for an end-of-the-semester presentation to the client.
LASD has four schools – Kelly Elementary (K-3), Linntown Intermediate (4-5), Donald H. Eichorn Middle School (6-8), and Lewisburg Area High School (9-12) – serviced by two bus ‘runs.’ In the morning, a fleet of 16 buses picks up middle school and high school students from their bus stops and takes them to their schools before heading back out to the neighborhoods to pick up the elementary and intermediate school students. The process repeats in the afternoon with the same two runs.
The school bus group used ArcGIS to map the locations of LASD’s bus depot, schools, bus stops and student home addresses. Next, they used the ArcGIS Network Analysis tool Find Route to generate map layers showing the current routes followed by LASD bus drivers in the morning and afternoon to pick-up/drop-off students. The ArcGIS Network Analysis tools allow users to specify numerous parameters to specify how the bus traverses the network – for example, which roads it can or cannot travel, what direction the bus can approach a stop from (e.g. to ensure students don’t have to cross the street to get on), if and when the bus can do a U-turn, etc. Behind the scenes, the network analysis tools rely on mathematical algorithms, some of which were already familiar to the students from their course work at Bucknell.
Once students had mapped the current routes, they were able to generate baseline metrics such as total distance traveled per route and across all routes; total time traveled per route and across all routes; average student wait time, average student travel time) to use as their reference for generating new options for optimized routes. The goal for optimizing routes was to decrease total distance traveled across the bus routes while staying within an acceptable range of allowable student wait and travel times. Students used a variation on the Find Routes tool that allowed the software to reshuffle the order of the current bus stops along existing routes to make the routes more efficient. This approach generated a small decrease in total distance traveled. In addition, they learned how to use the ArcGIS Network Analyst Vehicle Routing Problem (VRP). The VRP tool is designed to evaluate a set of ‘orders’ (in this case, bus stops to be serviced) and recommend an optimal number of vehicles needed to service those orders. Moreover, the VRP tool assigns ‘orders’ to routes based on how the orders are clustered. In other words, it optimizes the assignment of bus stops to routes. Using the VRP tool, students were able to devise new routes that generated significant decreases in total distance traveled by LASD buses – potentially saving hundreds of thousands of dollars and countless volume of greenhouse gas emissions over time.
Public Transit Group
- Client: United Way of Susquehanna Valley and Central Pennsylvania Transportation Coalition (CPTC)
- Problem: Develop materials for a feasibility study to show the need for and potential impact of a fixed route transit system for a 5 county area in Central Pennsylvania.
Given the nature of this project and the fact that its work is ongoing, at this time we can only provide a basic overview of work done by students (Elise Covert ‘20, Zack Feit ‘20, Alexandra Koumas ‘20 – all Mathematics majors, and Megan Fournier ‘19 – Management) in the public transit group. We will post an updated, more detailed account of their work at a later date.
Students in the public transit group worked with United Way of the Greater Susquehanna Valley and members of the Central Pennsylvania Transportation Coalition (CPTC) to assess the need for a potential fixed route public transit project to serve a 5 county area in Central Pennsylvania. Their primary goal in the project was to provide data-informed recommendations for a bus route, bus stops, and time tables that would optimize potential ridership and address both workforce development and healthcare accessibility needs identified in the region.
Throughout the semester, students met with members of the Central Pennsylvania Transportation Coalition (CPTC), an organization comprised of numerous public and private sector human service and transportation-related organizations in the central Pennsylvania region. These meetings gave students an opportunity to gather information on existing transportation options and workforce development/healthcare access needs – and most importantly, to hear directly from the key stakeholder organizations about their needs, wants, priorities, and concerns. As the semester progressed, the students were added to the meeting agenda to present their interim findings and recommendations and to gather feedback from the group.
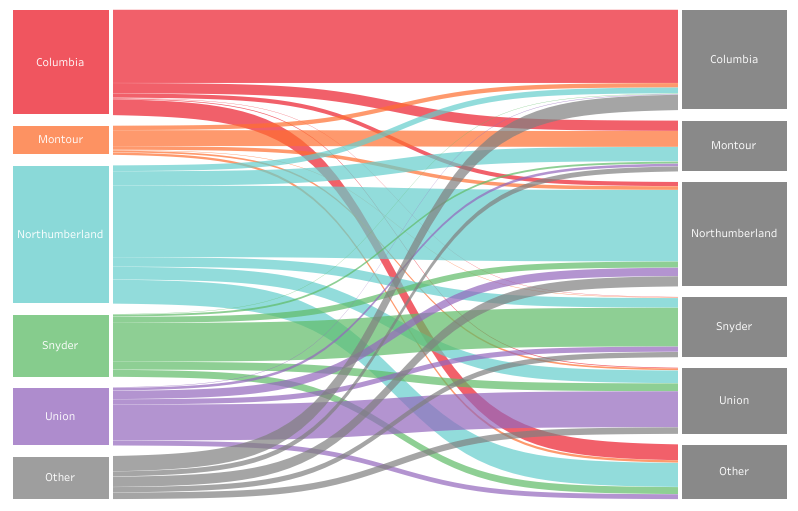
Digital pedagogy & scholarship tools and methods were used extensively by the group throughout the project. Data from employers, regional transit organizations, and the American Community Survey was used to quantify need/potential ridership and develop a Transit Propensity Index. The students used ArcMap to create map layers, perform spatial analysis and publish storymaps and used Tableau to create a Sankey Diagram and Interactive Commuter Flow visualization.

Course: MATH219: Solving Industrial Problems
Faculty: Nathan Ryan
DP&S Liason: Janine Glathar
Date: Spring 2019